





Execution
Contents
When you execute an endpoint, PostHog runs your query and returns the results. This page explains what happens under the hood and how to control execution behavior.
Trying it out
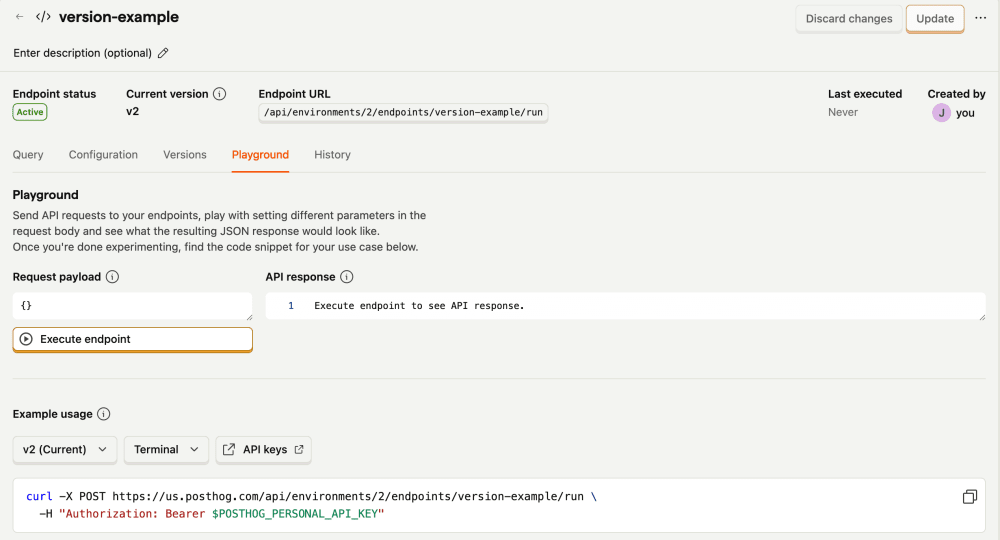
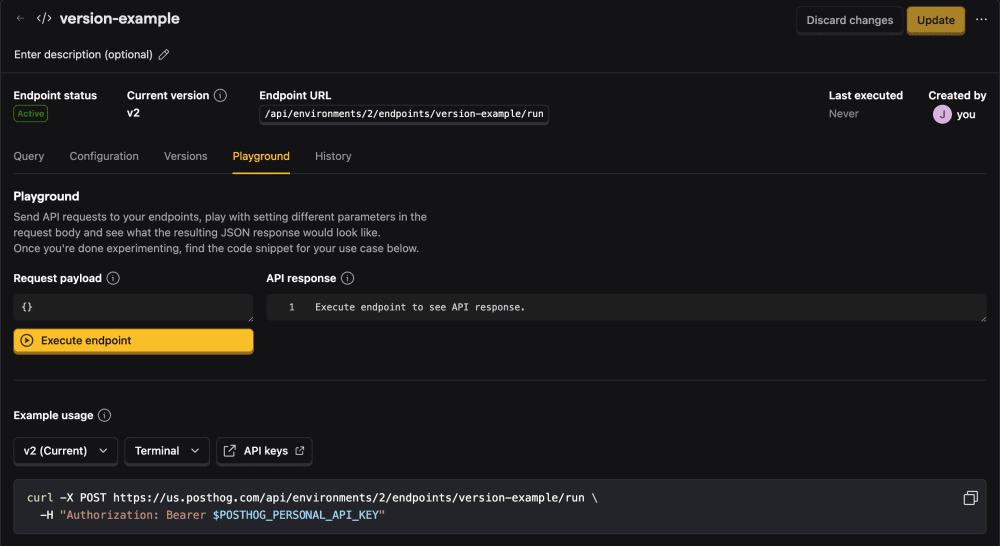
Before integrating an endpoint into your app, use the Playground tab on the endpoint's page to experiment. You can test different parameters and see the response format without writing any code.
Execution modes
PostHog uses one of two execution modes depending on your endpoint configuration:
Direct execution
Runs the query directly against the database. This is used when:
- The endpoint version you're executing is not enabled
- Or, you request a fresh calculation with
refresh: "direct"on a materialized endpoint
Materialized execution
Reads from pre-computed results stored in S3. This is faster but only available when materialization is enabled and complete.
The refresh parameter
Control query behavior when executing an endpoint:
| Value | Behavior |
|---|---|
cache | (default) If available, return cached results. Otherwise, either return the materialized results or run the query against raw data, depending on whether the endpoint is materialized. |
force | Forcefully bypass cached results, and either return materialized results or run the query against raw data, depending on whether the endpoint is materialized. |
direct | Only valid for a materialized endpoint. Bypass the materialized results and run the query against raw data. |
Response format
A successful response (HTTP 200) includes:
results– Array of rows, each row is an array of valuescolumns– Column names matching the order of values in each rowexecution_id– Unique identifier for this execution, useful for tracing results to their log entries- Additional metadata fields for materialization status, endpoint version, etc
Error responses
Query timeouts, memory limits, oversized query text, and estimated execution time limits return HTTP 400. When the shared ClickHouse query pool reaches capacity, it returns HTTP 503.
These responses include:
type– Error category, which isserver_errorfor these errors, including HTTP 400 responsescode– Error code that your client can use to choose an actiondetail– Error description and recommended actionattr– Request field that caused the error, ornullwhen the error does not refer to a field
For example, a query that exceeds the execution time limit returns HTTP 400:
Use the HTTP status and code to handle these errors in your client. Do not use the detail text to identify an error.
- For HTTP 400 query performance errors, change the query before you retry
- For HTTP 503 with
code: "query_capacity", wait for the duration in theRetry-Afterresponse header before you retry
See query performance errors for the error codes and recommended actions. See capacity errors for retry guidance.
Debugging
Pass debug: true in the request body to include additional debugging information in the response:
Main bit of extra information here to help you debug is the hogql field which includes the exact query that's been run against our database, mostly useful when you want to verify the query ran against a materialized endpoint.
Execution logs
The Logs tab on an endpoint's page shows one log entry per execution. Each entry includes metadata like the execution path (inline or materialized), cache outcome, duration, and row count.
Both successful (INFO) and failed (ERROR) runs appear in the logs, including rejected requests that fail validation (for example, an invalid refresh value). Filter by log level or search by free text to find specific entries.
For a successful run, the log entry's instance ID matches the execution_id in the run response. Use this ID to find the log entry for a result.